Projects

Driving Foundational AI User Researcher for Meta Business Messaging

Project Overview

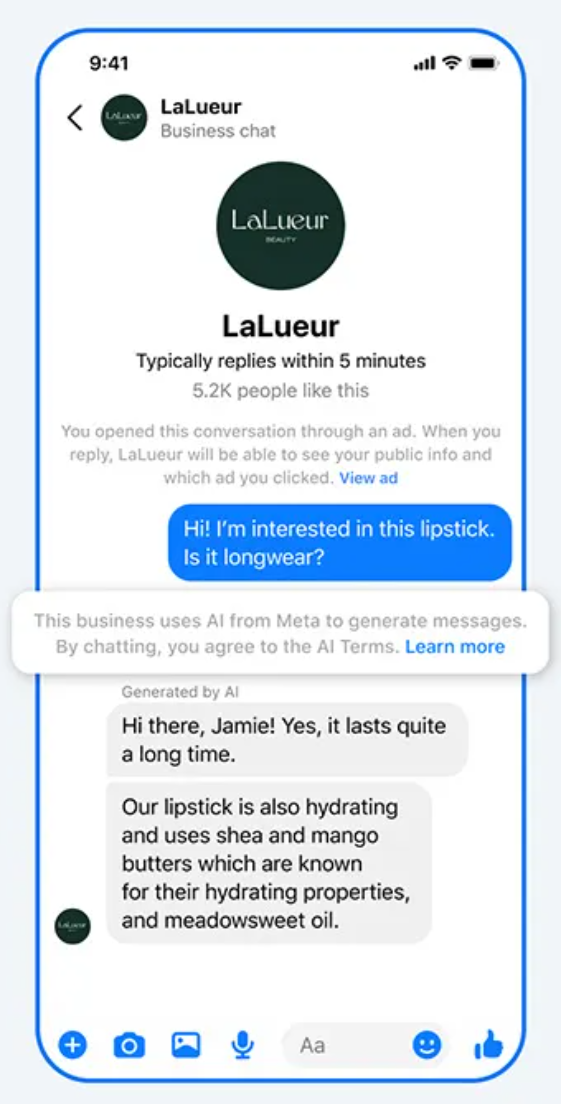
The main objective of this project was to research the value of AI-powered agentic business messaging as it transitioned from concept to execution, focusing on identifying areas of value for businesses on Messenger and Instagram. Understanding how AI could perform as a substitute for what had traditionally been human customer support interactions, like giving information about products, was critical particularly for small businesses that had very few employees.

Key Responsibilities

As the Quantitative UX Researcher, I led multinational alpha, beta and general availability studies combining survey data with platform interaction data. I managed the research process, including survey design, data analysis, and communicating findings to stakeholders. My approach involved close collaboration with qualitative researchers, providing them with user profiles and targeted outreach lists to ensure we spoke with the right participants.

Technical Approach

For data analysis, I utilized internal survey tools, SQL for data retrieval, and Python for manipulation, allowing efficient extraction of relevant information. When we encountered broken eligibility criteria for survey participants, I was able to recover the data by finding other criteria by which to check whether the user had interacted with an AI or a human. I determined whether the data was random or systemic, to help determine whether the data was still representative as well as to understand what the likely failure point was.

Working with the Data Engineering team, we identified and resolved these issues to maintain data integrity on future projects. To address data eligibility challenges that delayed our research timeline, I implemented survey weighting techniques ensuring our results represented target populations accurately. This critical step validated our findings across different user segments and allowed us to confidently present recommendations to stakeholders.

Impact & Findings

Through analysis of platform interaction data and survey responses, I uncovered key insights:

  • Users don't have a worsened experience when interacting with the AI but do get much more timely responses
  • Small businesses were able to increase the amount of work they can perform when they don't have to worry about customer support
  • These insights directly influenced the deployment strategy, ultimately enhancing customer engagement and satisfaction.

Professional Growth

The project marked my first experience with a non-iterative research approach, teaching me valuable lessons about quickly bringing products to market to achieve relevance. I learned that prioritizing speed and responsiveness is essential for success in a rapidly evolving landscape. These insights will guide my future work as I apply these lessons to drive innovation and enhance user experiences in upcoming projects.

Pulse of Business Messaging: Tracking Business Messaging Across 15 Languages and Hundreds of Thousands of Monthly Responses

Project Overview & Scale

As the Quantitative UX Researcher for customer Business Messaging tracking, I led the implementation of a global research initiative designed to continuously monitor consumer sentiment across messaging platforms. The project tracked key metrics including value perception, relevance, and negative experiences associated with business messaging, serving as a critical guardrail against messaging overload. With hundreds of thousands of monthly responses spanning both Instagram and Messenger across priority markets, this project represented one of our largest-scale research efforts, providing visibility into global messaging trends and user sentiment.

Key Responsibilities & Technical Approach

My responsibilities included survey design, determining optimal invitation volumes, establishing data pipelines, and building comprehensive dashboards to visualize insights for stakeholders.

To effectively analyze the massive dataset, I utilized:

  • Internal survey tools for data collection across multiple markets
  • SQL for efficient data retrieval from our databases
  • Python for sophisticated data manipulation and statistical analysis
  • Interactive dashboards allowing stakeholders to filter by region, platform, and demographics

Working across diverse global markets presented unique challenges that required thoughtful solutions and cultural adaptations, including translation. By implementing weighted sampling techniques, I ensured our findings accurately represented user populations across all markets despite varying response rates.

Impact & Future Direction

These insights directly informed critical product decisions, including the implementation of message frequency capping in high-volume markets and the optimization of delivery timing based on regional usage patterns. In the future, our hope is to use this abundance of data to understand what levers are able to be pulled to improve business messaging with a much longer understanding of effects.

Microsoft Employee Experience Survey Methodology Overhaul

Project Context & Challenge

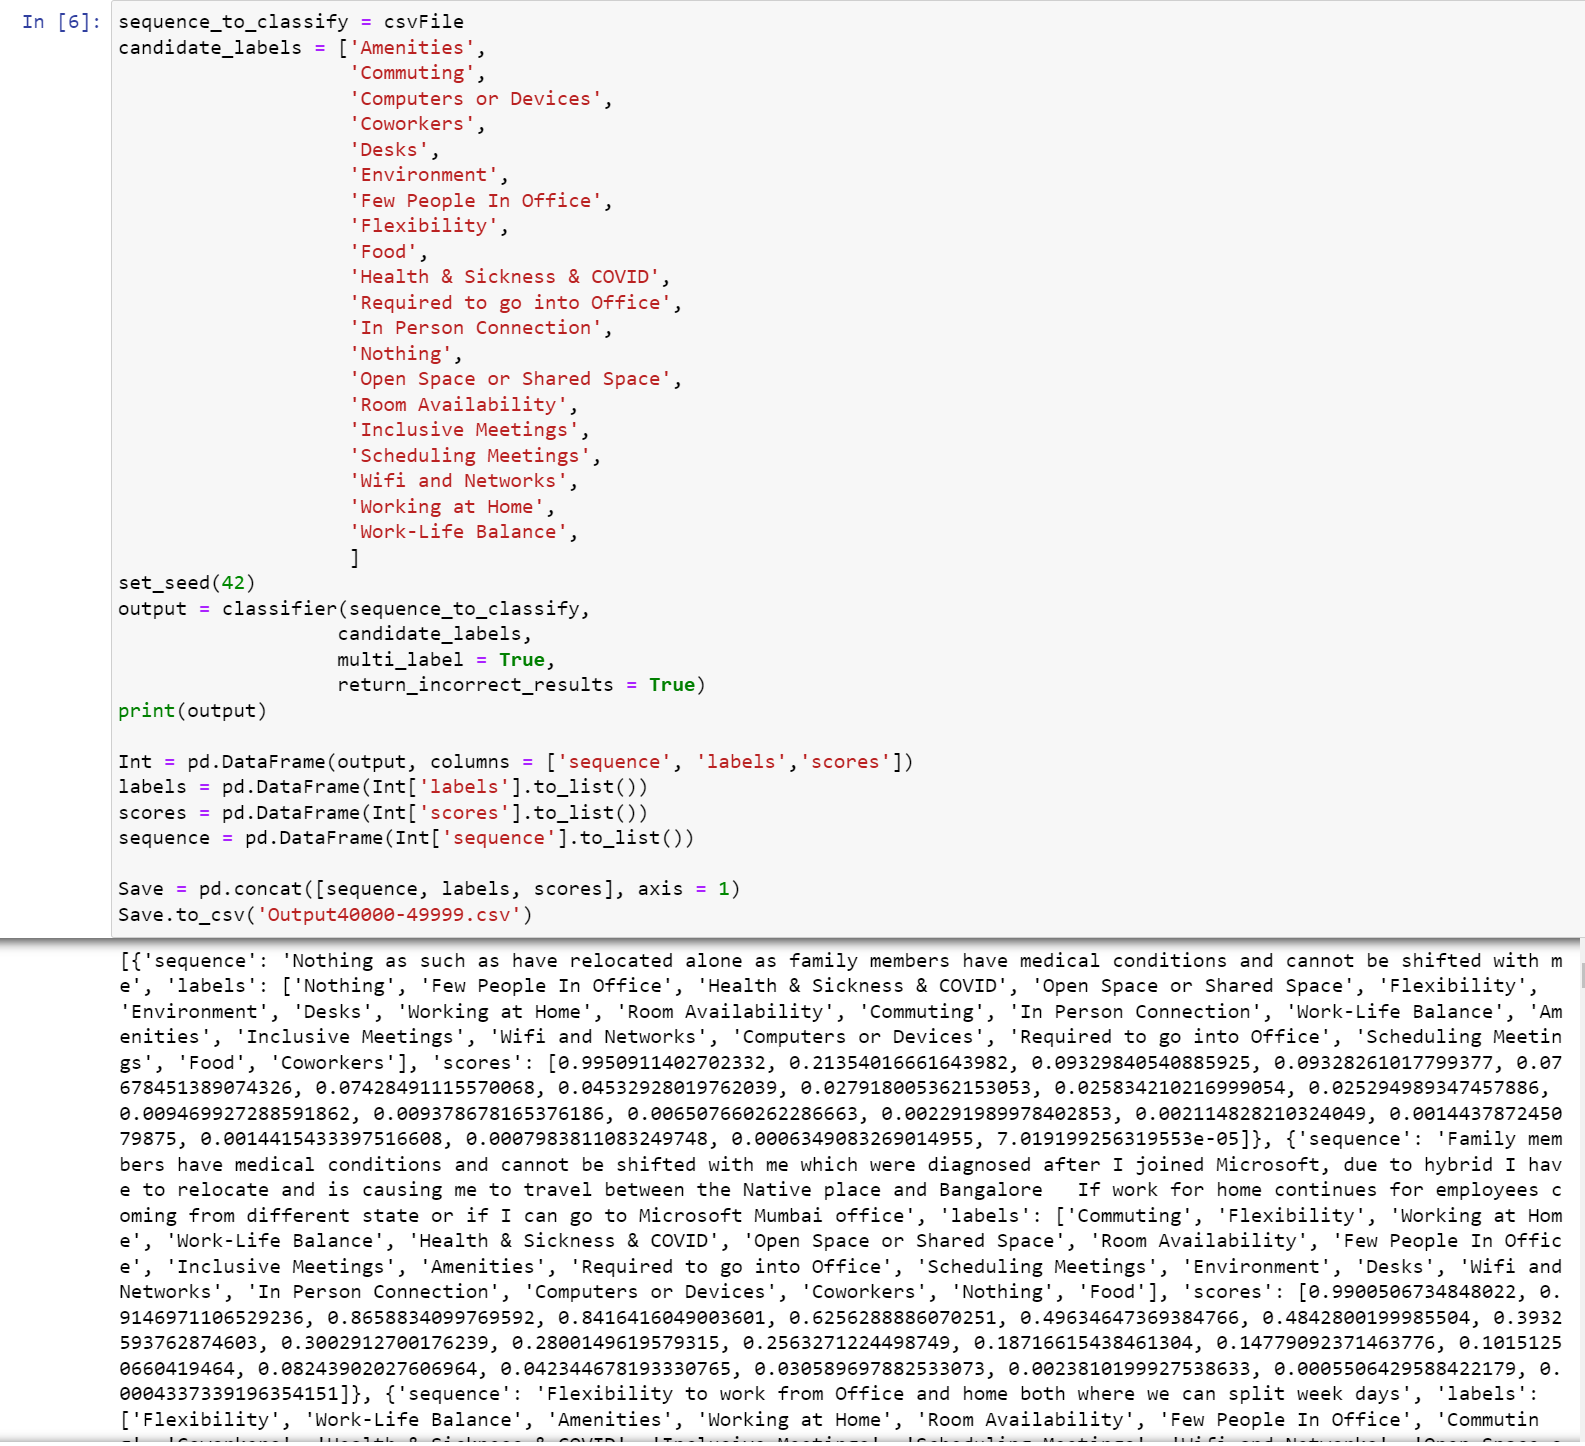
Microsoft has a strong methodological process involving internal surveys used to test products and methods. My role was to support the Hybrid workstream which focused on improving employees' experience in a new working environment. The results of this workstream frequently fed into publicly available output, as well as internal reporting to the units that manage portions of the experience. Our group was gaining great data on an important topic but was constantly coming up against the same problem; utilizing it effectively. With 2000+ responses each month, the amount and variety of data meant that just processing open-ended responses and updating newsletters took up most of my time. If we were going to utilize this wealth of data effectively, we required a new approach.

Methodology Innovation

To address the challenge of efficiently utilizing the wealth of data collected through our internal surveys, I proposed a significant overhaul of the survey methodology. My approach included:

  • Implementing a modular survey structure, breaking it down into smaller, focused sections
  • Serving different respondents different question sets, reducing individual survey length from dozens to fewer than a dozen items
  • Increasing response rates through shorter, more targeted surveys
  • Gaining wider coverage across various aspects of the employee experience

Data Collection Optimization

Another important modification was the shift from open-ended questions to closed-ended ones, designed to be more easily actionable. While open-ended questions provide valuable insights, they can be time-consuming to analyze and can result in a loss of structured data. By providing respondents with a set of predefined options in closed-ended questions, we ensured that we captured specific, quantifiable responses.

However, we also recognized the importance of not losing valuable information that may be emergent. To address this concern, we included an "Other" option in each closed-ended question, allowing respondents to provide additional context or input when necessary. This approach struck a balance between structured data collection and the flexibility to capture unexpected insights. With these changes, I not only streamlined the survey process but also improved our ability to extract actionable insights from the data.

A/B Testing Chase's acquisition pipelines to increase monthly revenue by $20M

Role & Responsibility

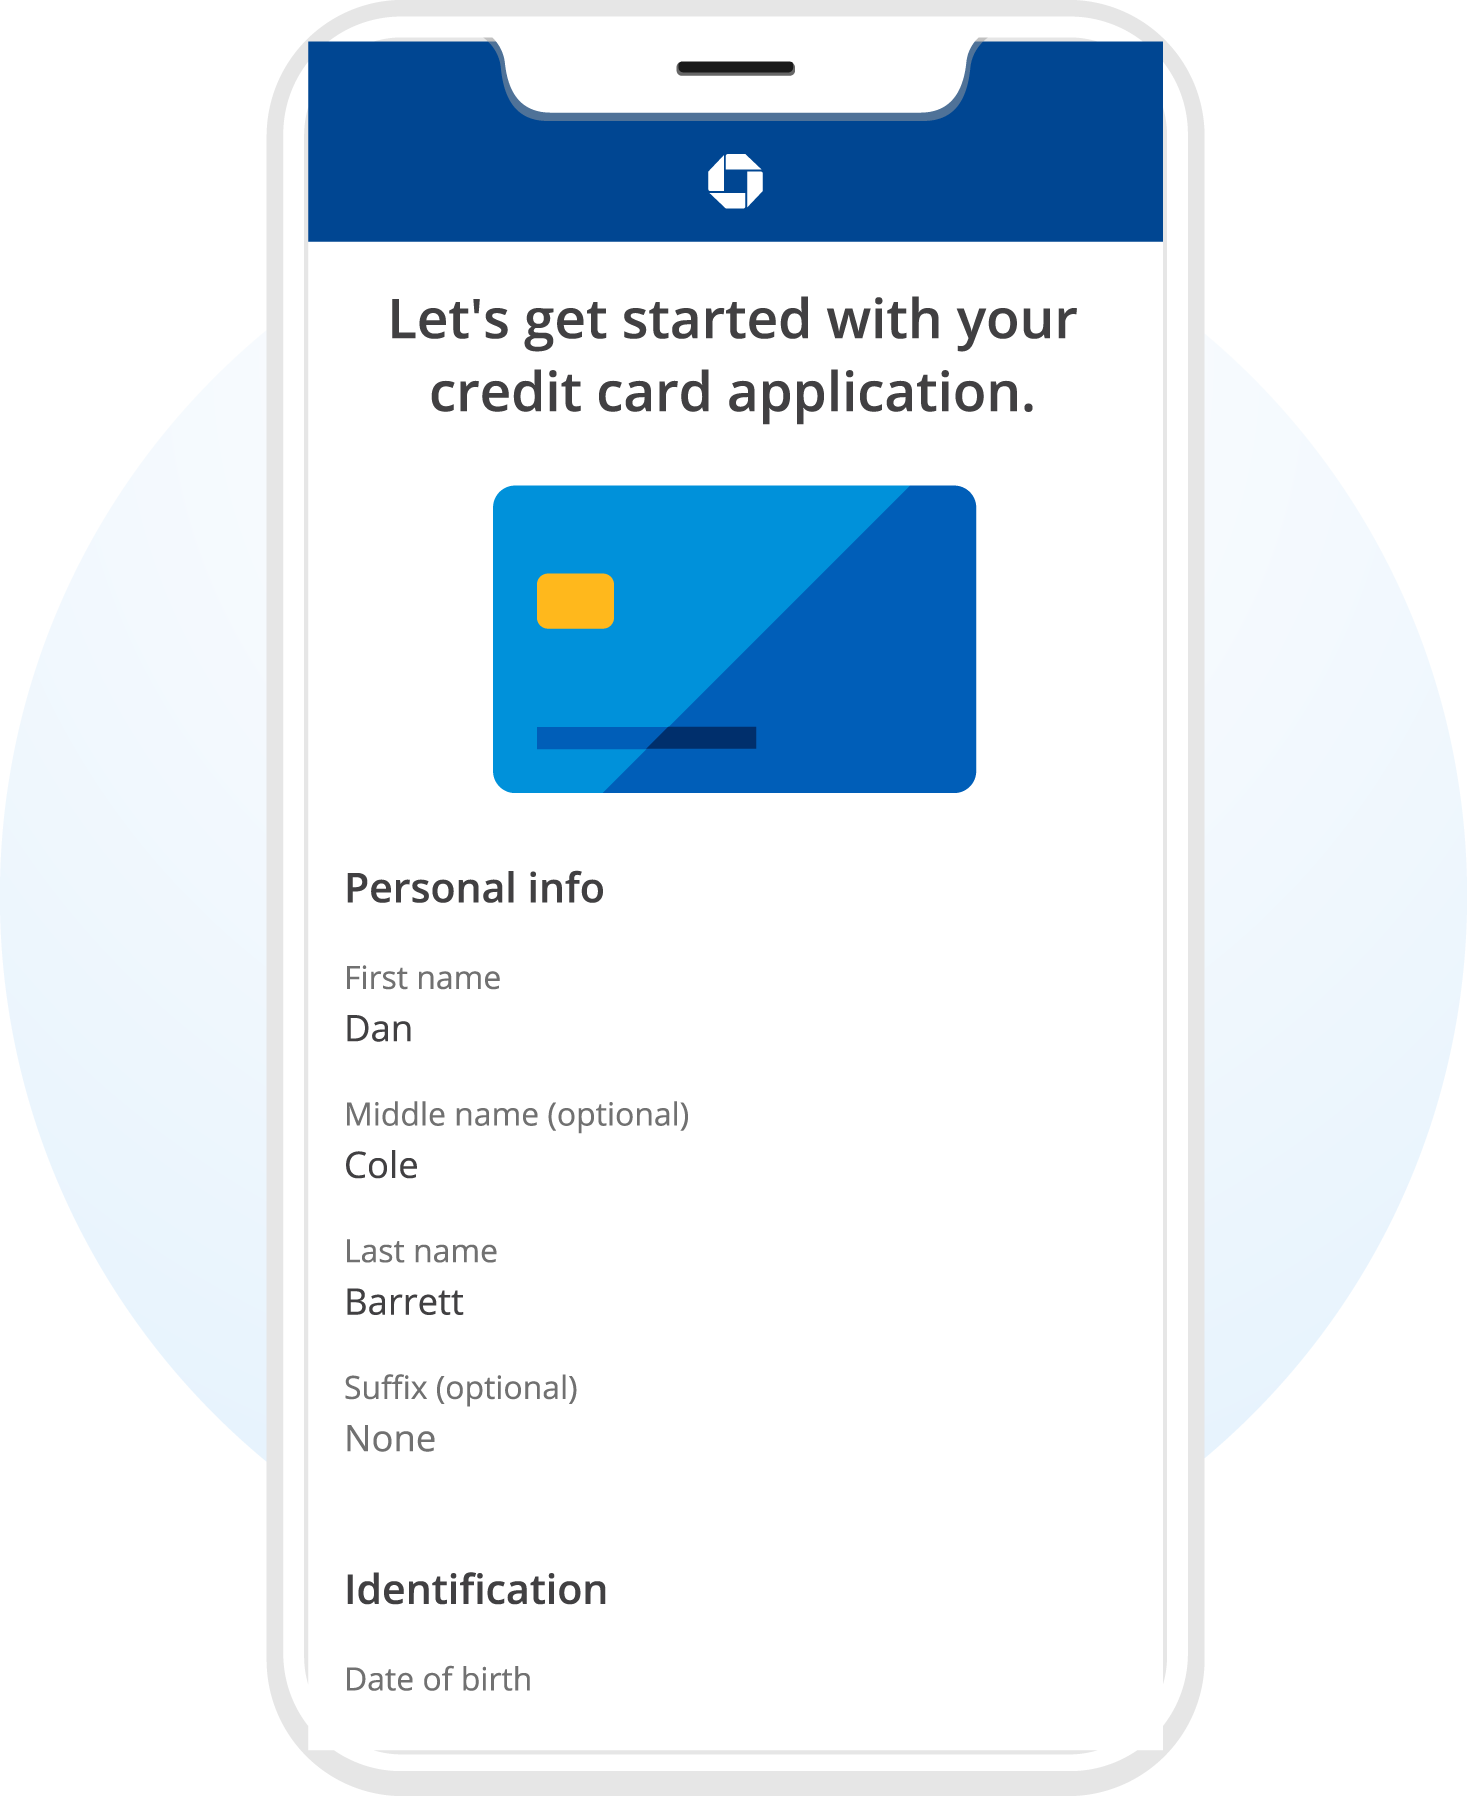
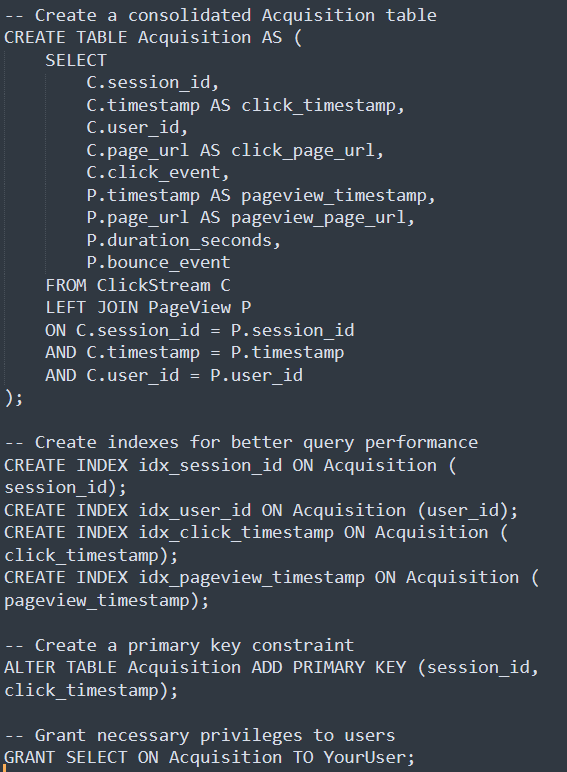
During my tenure at JP Morgan Chase, I supported a series of initiatives aimed at enhancing the digital user experience and boosting digital account acquisition through owned advertisements and links. I was responsible for supporting acquisition research across both public and private digital portals, with a focus on data-driven decision-making.

Research Approach

Through rigorous A/B testing, we meticulously fine-tuned our strategies to ensure not only that more people were arriving to acquisition funnels but also that those that did arrive intended to open an account. This was atypical because the majority of the analysis on acquisition was not accounting for the full journey. Teams either considered conversion from owned media to the application or the start of the application to the end, which caused issues like many people clicking vague links to explore but not converting or offering products to customers we should know don't have the financial history to qualify for them.

Key Initiatives & Achievements

One of the key achievements during this period was the successful implementation of personalized product recommendations for customers based on their existing holdings. By tailoring product offerings to individual customer profiles, we not only improved user satisfaction but also significantly increased digital account acquisition.

  • Implemented personalized product recommendations based on customer profiles and existing holdings
  • Revamped enrollment flows for various products to make them more user-friendly and intuitive
  • Removed barriers to entry and encouraged more customers to engage with our products
  • Made continuous incremental changes, each tested to ensure improvements were marginal and sustained
Impact

As a result of these strategic changes, we witnessed a 7% increase in total account volume year over year, primarily driven by an increase in deposit accounts, translating to approximately $20 million in revenue each month.

Project Image 1

Projects

Creating a data pipeline to analyze Microsoft's survey data programatically

Initial Challenges

During my early days at Microsoft, my primary focus was analyzing respondent data and adjusting mailers to inform stakeholders. It quickly became apparent that more time to research would allow me to uncover novel insights, which was a more valuable use of time. To address the analysis hurdle, I developed a series of scripts designed to automate various aspects of data management. These scripts:

  • Streamlined the organization of respondent data
  • Validated survey rating confidence intervals
  • Populated inner-company communications
  • Fine-tuned and deployed a BART-large-MNLI topic modeling solution to classify open-ended responses
Fine-tuning increased topic classification accuracy from 61% to 83%. This change in process not only streamlined our data analysis but also introduced an objective tracking system, eliminating the need for extensive manual work and allowing greater consistency as we no longer relied on human ratings.
Automated Real-Time Response Processing

As part of the evolution of this system, I further automated the process, ensuring that every week, incoming responses were seamlessly processed and analyzed in real-time. This automation allowed us to track and compare trends in employee comments over time, providing invaluable insights into the evolving sentiments and needs of our workforce. By implementing this workflow, we significantly enhanced our ability to understand employee feedback, ultimately contributing to a more responsive and employee-centric approach within Microsoft.

Project Image 1

Engineering a data lake for digital acquisitions at Chase

Project Overview

To facilitate a unified product tracking system across Chase, I spearheaded a significant technical initiative aimed at constructing a robust data lake harnessing behavioral clickstream data associated with customer acquisition. The underlying behavioral database of this acquisition data repository was substantial, given that Chase.com ranks among the top 50 most frequently visited websites in the United States, with 800 million monthly visits and 6 billion page views.

Initially, the query times for this expansive database were prohibitively long due to their size, and the data within it was not structured in a user-friendly manner, necessitating analysts to perform complex table joins to extract meaningful insights.

Technical Challenge and Solution

My role involved architecting a faster, more intuitive database capable of analyzing acquisition activities across all consumer banking products. This process required a mastery of both the data and the business context. Data mastery was essential as it allowed selection of the right columns and unique indexes to speed up the process.
  • Reduced analyst query times by over 90%, transforming insight generation from hours to near-instantaneous retrieval
  • Simplified database structure, consolidating four complex tables into a single, streamlined table
  • Developed an efficient Teradata script that automated data transformation while maintaining integrity and scalability
Project Impact

The resulting data table offered unprecedented capabilities to filter and analyze pivotal fields such as:

  • Product types
  • Customer Demographic
  • Specific traffic-driving links
This solution provided invaluable insights into Chase's digital acquisition strategies and revenue generation. It enabled data-driven assessments of advertising effectiveness and optimizations in user experience, significantly contributing to the bank's overall strategic objectives.

Strategic Significance
By creating an automated, efficient data transformation process, the project ensured continuous, reliable data insights—a critical capability that persisted even in my absence. The initiative exemplified how strategic data engineering can dramatically enhance organizational decision-making capabilities.
Project Image 1

Developing a customer segmentation approach to reduce marketing expenses by 20%

Project Overview

At Independence Blue Cross, I led a strategic project to optimize direct mail marketing for health insurance enrollment through advanced predictive modeling. The primary objective was to enhance the cost-effectiveness and efficiency of our marketing campaigns by leveraging data science techniques.

Technical Approach

I employed Random Forest machine learning techniques to build predictive models that could assess the likelihood of individuals enrolling in health insurance after receiving our mailers. This sophisticated approach required comprehensive data analysis, including:
  • Rigorous data preprocessing
  • Sophisticated feature engineering
  • Careful model selection and validation
The core of my methodology involved fine-tuning the algorithm to identify prospects with the highest enrollment potential. This involved a multifaceted analysis of key factors such as demographics, health history, and historical mailing response patterns.

Project Impact

The data-driven approach yielded remarkable results:

  • Reduced marketing expenses by over 20%
  • Maintained comparable enrollment numbers compared to previous campaigns
  • Significantly improved operational efficiency and marketing return on investment
By precisely targeting prospects with the highest likelihood of enrollment, we transformed our marketing strategy from a broad-based approach to a laser-focused, analytically driven campaign.

Project Image 1

Projects

Unifying Digital Customer Acquisition at Chase

Project Context

When I arrived at Chase, the organization faced significant data management and collaboration challenges. Each product group (Checking, Savings, Credit Cards, Personal Loans, Mortgages, Auto Leases and Auto Loans) operated in silos, performing independent analysis, reporting, and communication. This fragmented approach led to:

  • Inefficient resource allocation
  • Inconsistent performance analysis across product groups
  • Inability to prioritize bankwide success

Strategic Solution

I took the lead in developing a cohesive data management framework designed to facilitate consistent performance evaluation across various units. The core of this transformation was a comprehensive overhaul of data management practices.

Technical Approach
The project centered on standardizing two critical data sources:
  • Transactional enrollment data
  • Behavioral clickstream data associated with the customer acquisition process
My approach involved an in-depth research of the user journey, including meticulous tracking and documentation of all links and pages leading to customer applications. This detailed investigation allowed me to:
  • Construct a comprehensive taxonomy of user interactions
  • Create a sophisticated Teradata script that transformed billions of rows in the Adobe dataset
  • Develop a structured acquisition table with thousands of rows, enabling consistent analysis across product groups

Project Impact

The implementation of this standardized framework had profound implications for Chase's operational effectiveness:

Data Analytics Transformation

  • Established a universal data repository
  • Enabled easy comparison of performance metrics across different product groups
  • Facilitated data-driven discussions using a common script
  • Eliminated reliance on separate and delayed data sources

Organizational Benefits
  • Enhanced decision-making agility
  • Provided a holistic "All Chase" view of products
  • Enabled high-level product prioritization
  • Broke down competitive silos between product groups

Outcome and Impact

This organizational overhaul fundamentally transformed Chase's approach to data management and inter-departmental collaboration. By creating a standardized framework, we not only improved our data analytics capabilities but also fostered a more integrated, strategic approach to understanding and growing our business.

Project Image 1

Fixing Chase's platform-wide Interstitial feature

Project Context

In my role at JP Morgan Chase, I played a pivotal part in identifying and addressing a critical issue related to the effectiveness of the "Announcements" feature, which is intended to provide information on changes after a customer signs in. My research began with a fundamental assessment of the feature's performance, revealing a significant problem: the Announcements were consistently underperforming and falling far below expected metrics.

Problem Discovery

The initial investigation uncovered a stark performance issue: a dramatically low user visibility rate for Announcements. In some instances, the visibility rate was as low as 30%, meaning that despite the feature's design to reach all users, only a fraction were actually seeing these critical communications.

Root Cause Analysis
Digging deeper, I identified several key systemic issues:
  1. Competing Priorities: All "Sign in interstitials" were competing for display priority, creating a complex visibility challenge.
  2. Governance Gap: The platform responsible for showcasing these interstitials existed in an organizational blind spot—without clear ownership, there were no established controls or design guidelines.
  3. Inconsistent Design: A comprehensive examination revealed a severe lack of design cohesion across different sign-in interstitials.
  4. Technical Failures: Some interstitials were fundamentally broken, repeatedly disrupting users instead of being dismissed after initial display.
These technical and design shortcomings were not just theoretical problems. User feedback through our Voice of Customer (VOC) channels confirmed that these issues were causing significant user frustration.

Strategic Resolution

Taking decisive action, my team assumed control of the "Sign in interstitials" platform. Our comprehensive approach included:

  • Implementing robust design guidelines to ensure consistency and effectiveness
  • Repairing broken interstitials to prevent user disruption
  • Establishing clear controls for feature display and prioritization

Outcome and Impact

The initiative successfully transformed the Announcements feature, significantly improving user experience and our ability to communicate critical information to customers. By addressing both technical and design challenges, we created a more reliable and user-friendly communication channel.

Key Learnings

This project underscored the importance of holistic user experience design, demonstrating how seemingly minor technical issues can significantly impact customer communication and satisfaction.

Project Image 1

Projects

Hiring 5 team members at Chase to rebuild a depleted team

During the Great Resignation in early 2022 my team was depleted significantly and suddenly. I took on a role in re-expanding our team's capacity. Over the course of just three months, I successfully recruited and onboarded five new team members, effectively growing our team from three to eight members. This endeavor was not just about increasing headcount; it was about strategically identifying and bringing on board individuals who would not only fit seamlessly into our team culture but also excel in their roles.

To achieve this, I developed an objective criteria to evaluate potential candidates. This criteria encompassed both a behavioral portion of the interview process and a coding assessment. It was essential for us to assess not only technical skills but also interpersonal qualities that would contribute to a positive and productive team dynamic. Notably, each of these new hires not only successfully integrated into the organization but also demonstrated outstanding performance in their respective roles, consistently delivering valuable contributions to our team's success. All five of the team members that were hired were still in the organization adding value one year later, proving that the decisions made were the correct ones.

Project Image 1

Teaching team members at Microsoft data skills to increase their productivity

During my tenure at Microsoft, I had the opportunity to play a pivotal role in enhancing the capabilities of our qualitative UX research team. Recognizing the increasing importance of data skills in our field, I took the initiative to teach team members the fundamentals of scripting and coding. This endeavor aimed not only to empower team members with new technical skills but also to leverage these skills to boost productivity and the overall performance of our team.

I ensured that the training covered the basics of scripting and coding, making it accessible and applicable to individuals with varying levels of technical experience. Through hands-on workshops and personalized coaching, team members acquired the necessary skills to manipulate and analyze data efficiently, enabling them to draw deeper insights from their research findings. The benefits of this initiative were multifaceted. Not only did team members gain a new skill set that made them more self-reliant in data-related tasks, but it also led to a significant improvement in our team's overall productivity. With the ability to process and analyze data independently, our research projects became more streamlined and efficient. This, in turn, allowed us to provide more timely and data-driven insights to inform product development decisions.

Project Image 1

Learn more about me.

Quantitative UX Researcher, Data Scientist & Mentor

Terron is a skilled data scientist and quantitative UX researcher with industry experience in healthcare, finance and technology who is dedicated to optimizing user experiences through data-driven insights and innovative research.

  • City: New York City
  • Email: TerronGrahamPro@Gmail.com
  • Undergrad: Pennsylvania State University
  • Grad: University of Pennsylvania

He is seeking challenging opportunities where he can serve as a thought leader and mentor, contributing to an organization's growth both in terms of business success and cultural development. Terron is driven by a passion for fostering innovation and empowering products and teams to reach their full potential.

Skills

UX Methods

Survey Methodology

A/B Testing

Persona Creation

R

Tidyverse

dplyr

ggplot

Python

Transformers

Pandas

Numpy

SQL

Tableau

Adobe Analytics

Google Analytics